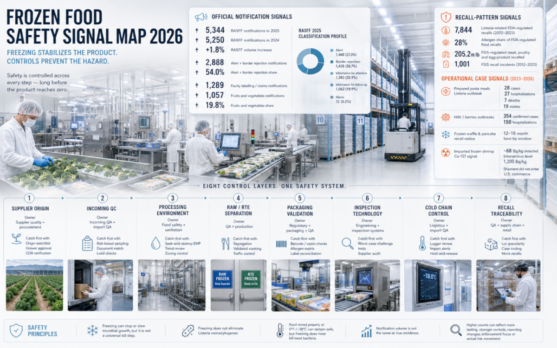
Frozen Food Safety Signal Map 2026
A frozen food safety signal map using RASFF, FDA, CDC and FSIS evidence to show where control failures start: supplier origin, Listeria, labels, inspection, cold chain and...
FrozeNet Visual Intelligence turns complex industry signals into clear, evidence-based visual analysis for professionals across the frozen food value chain. The series connects data from markets, energy, food safety, waste, cold chain operations, packaging, processing and regulation, then translates it into strategic maps that are easier to read, compare and use in decision-making.
These are not generic infographics. Each visual is built to explain where pressure, risk or opportunity appears inside the real frozen food system: sourcing, freezing, storage, transport, retail, foodservice, quality control and compliance. The goal is to help industry readers see patterns faster, question assumptions and understand how scattered signals affect margins, operations and commercial strategy.
A frozen food safety signal map using RASFF, FDA, CDC and FSIS evidence to show where control failures start: supplier origin, Listeria, labels, inspection, cold chain and...
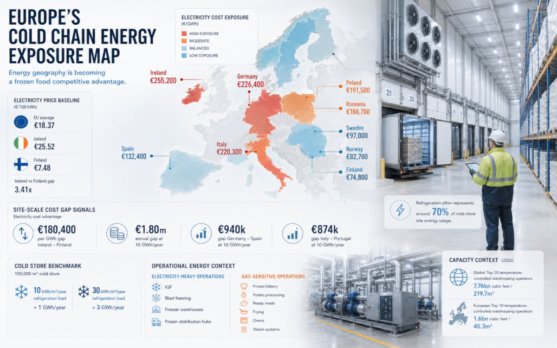
Europe’s Cold Chain Energy Exposure Map translates Eurostat non-household electricity prices into an operational lens for frozen food, showing where cold storage, freezing...
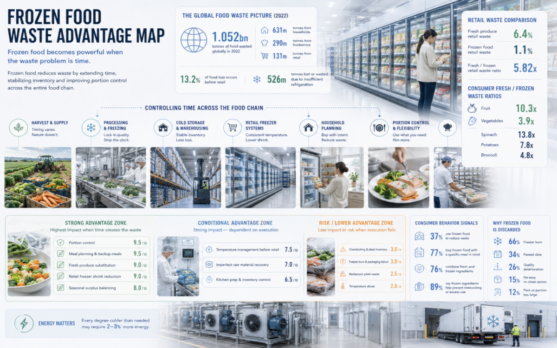
A visual map of where frozen food can reduce food waste, from retail shrink and household portion control to freezer burn, cold-chain risk and overclaimed sustainability claims.
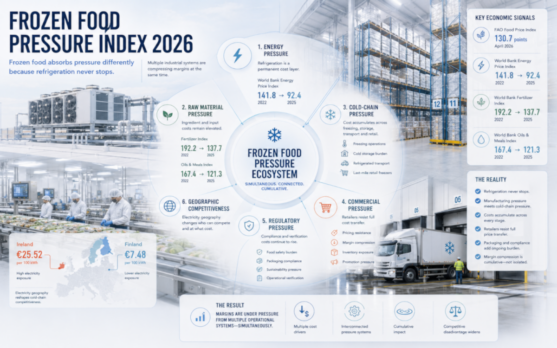
Frozen food margin pressure is shifting from commodities into conversion: energy, cold storage, packaging, safety and category-specific inventory signals.